Reports, evaluations, statistics

Tutorial: The reports part of CashCtrl allows evaluating accounting data, sales statistics and custom formulas.

Content 

  1. Report Sets
  2. Add report to set
  3. Arranging / moving reports
  4. Set time period
  5. Configure report / add text
  6. Customize columns
  7. Configure formular column
  8. Export reports
Illustration von Berichten aus CashCtrl

1. Report sets

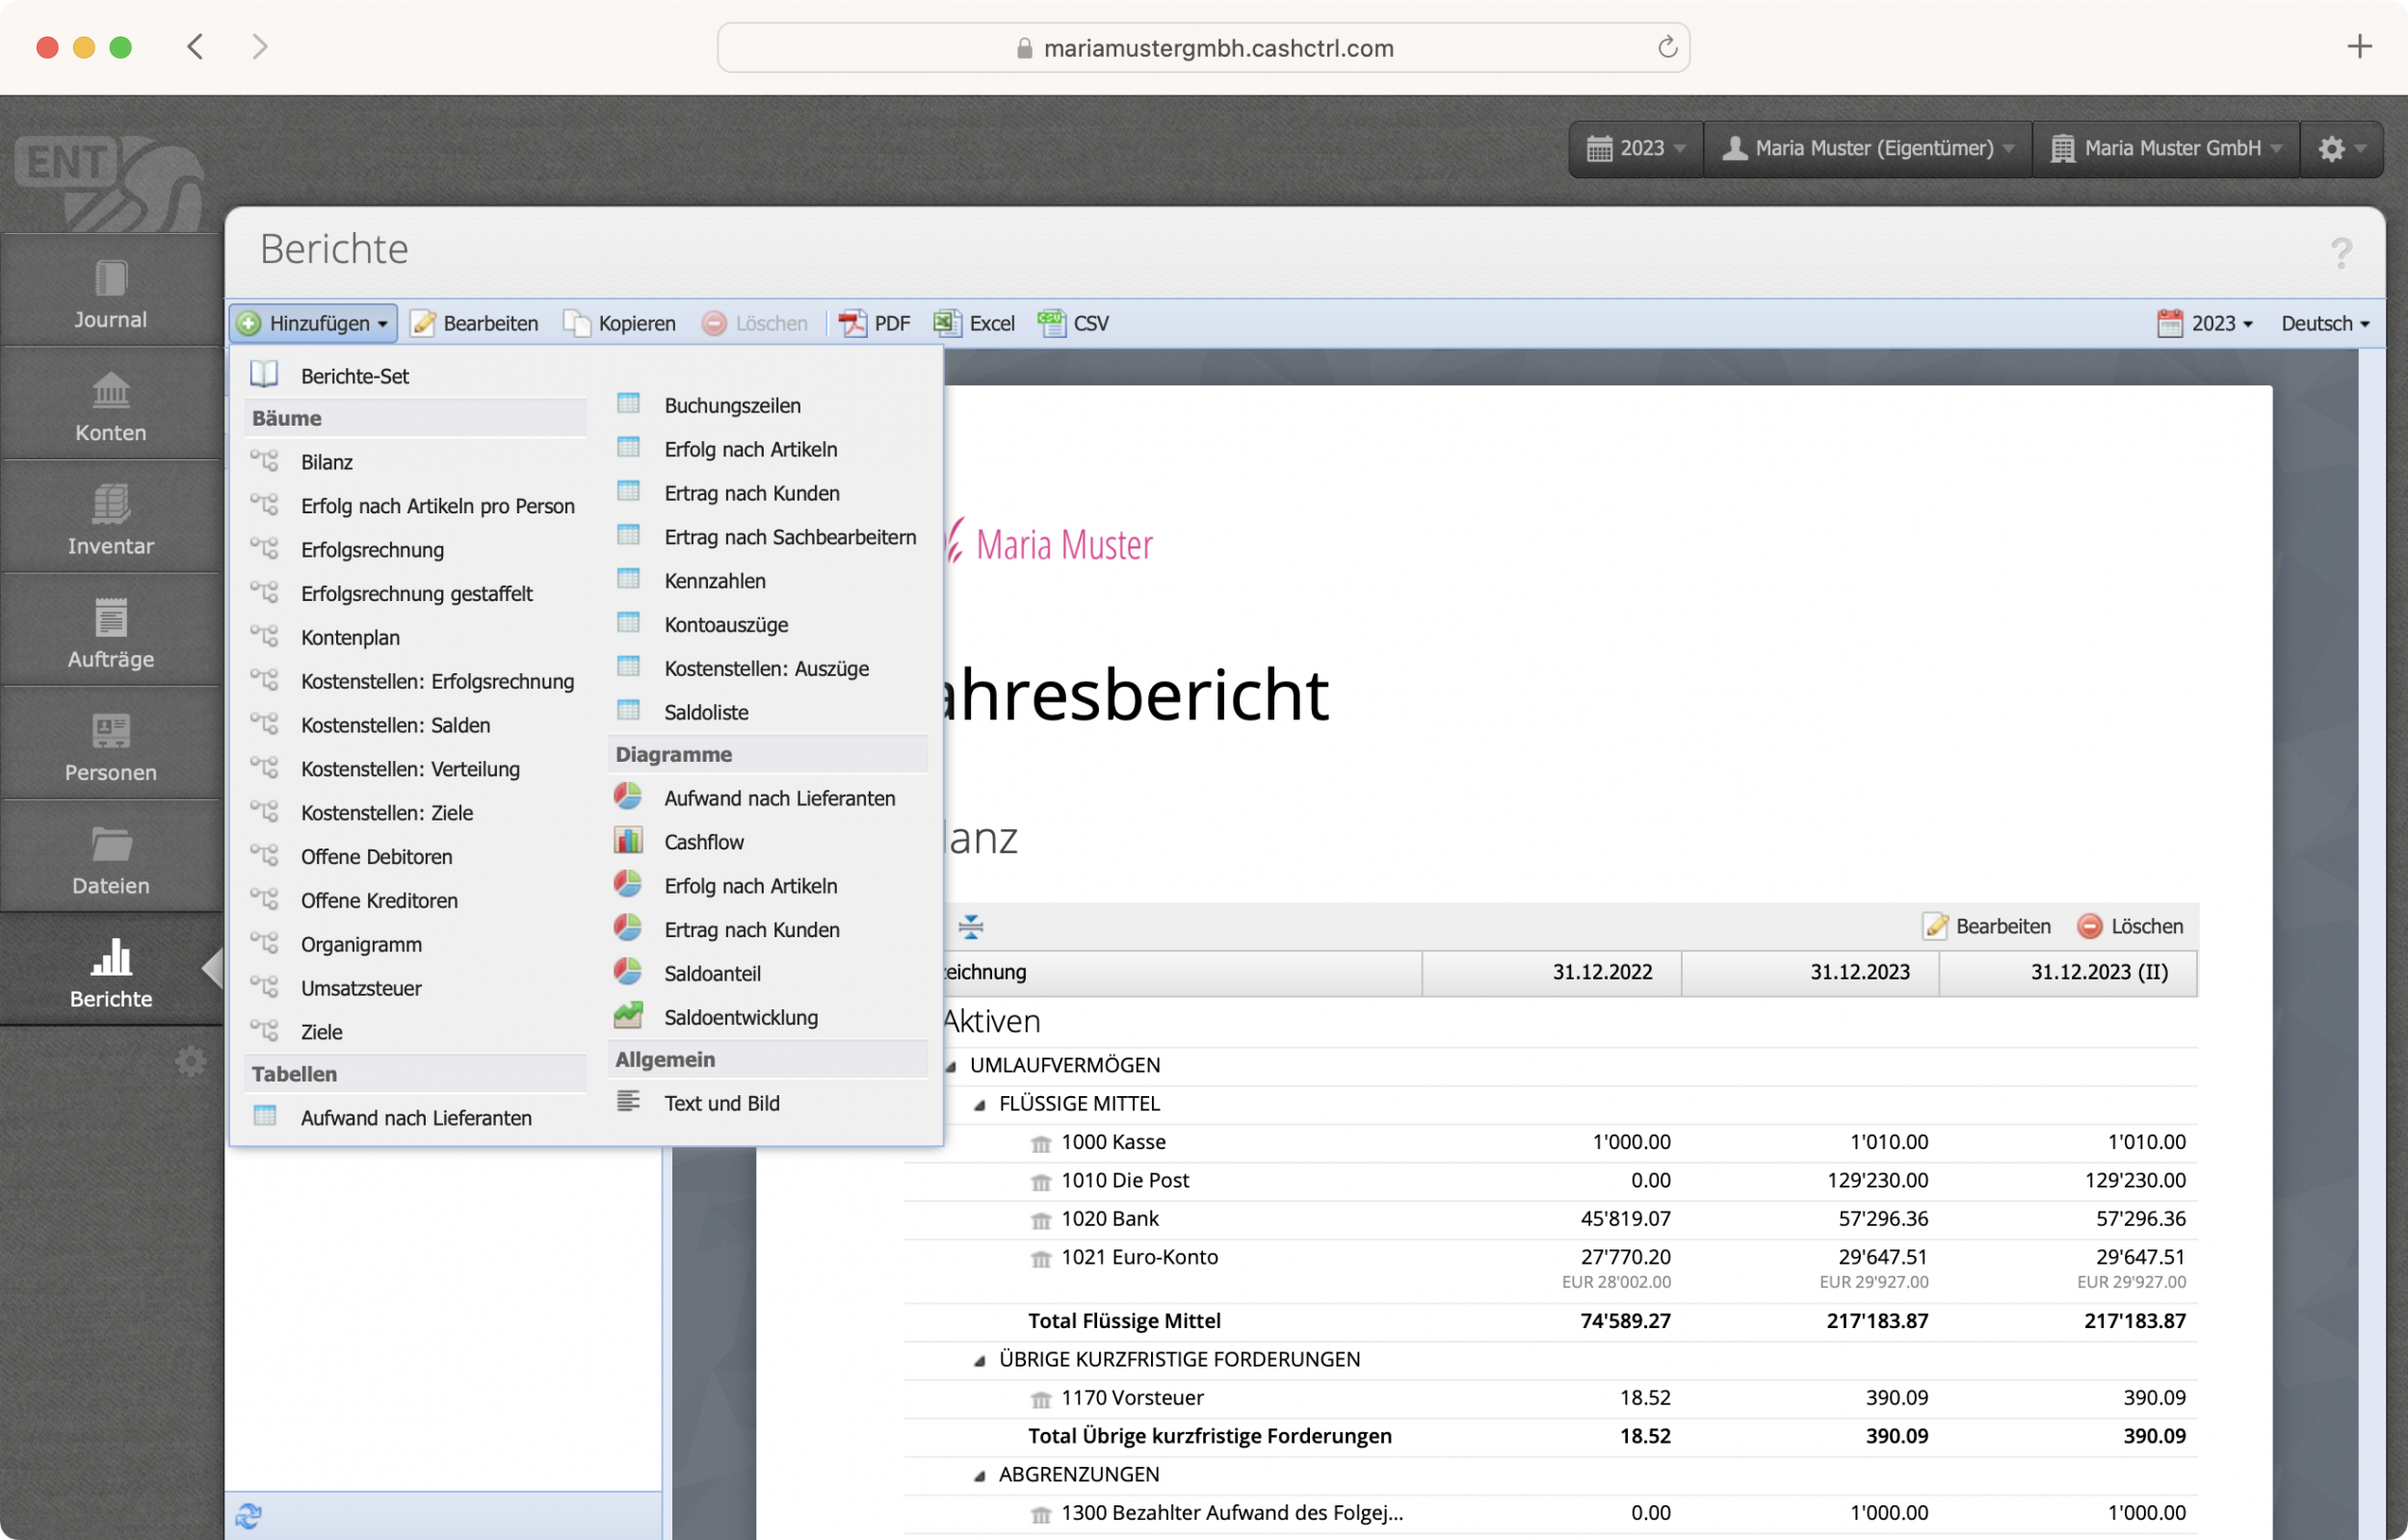
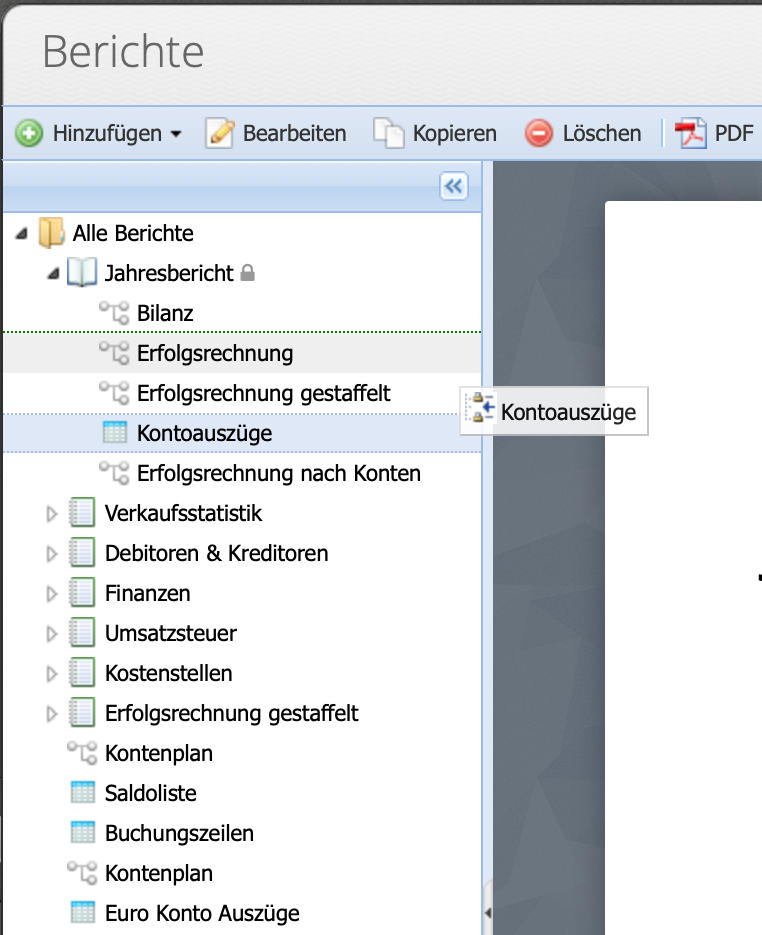
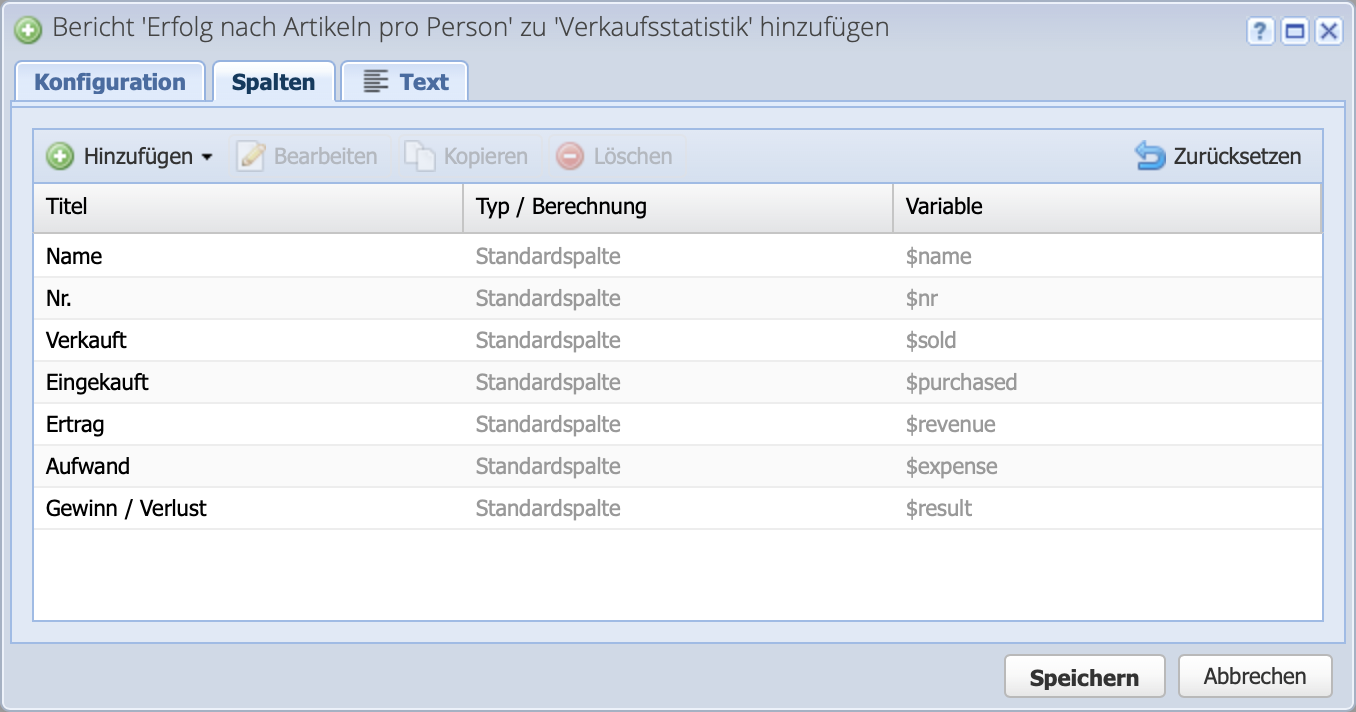
Individual report sets can be compiled under "Reports". Create a new set via Add report set. Subsequently, various reports can be added to the set via Add.

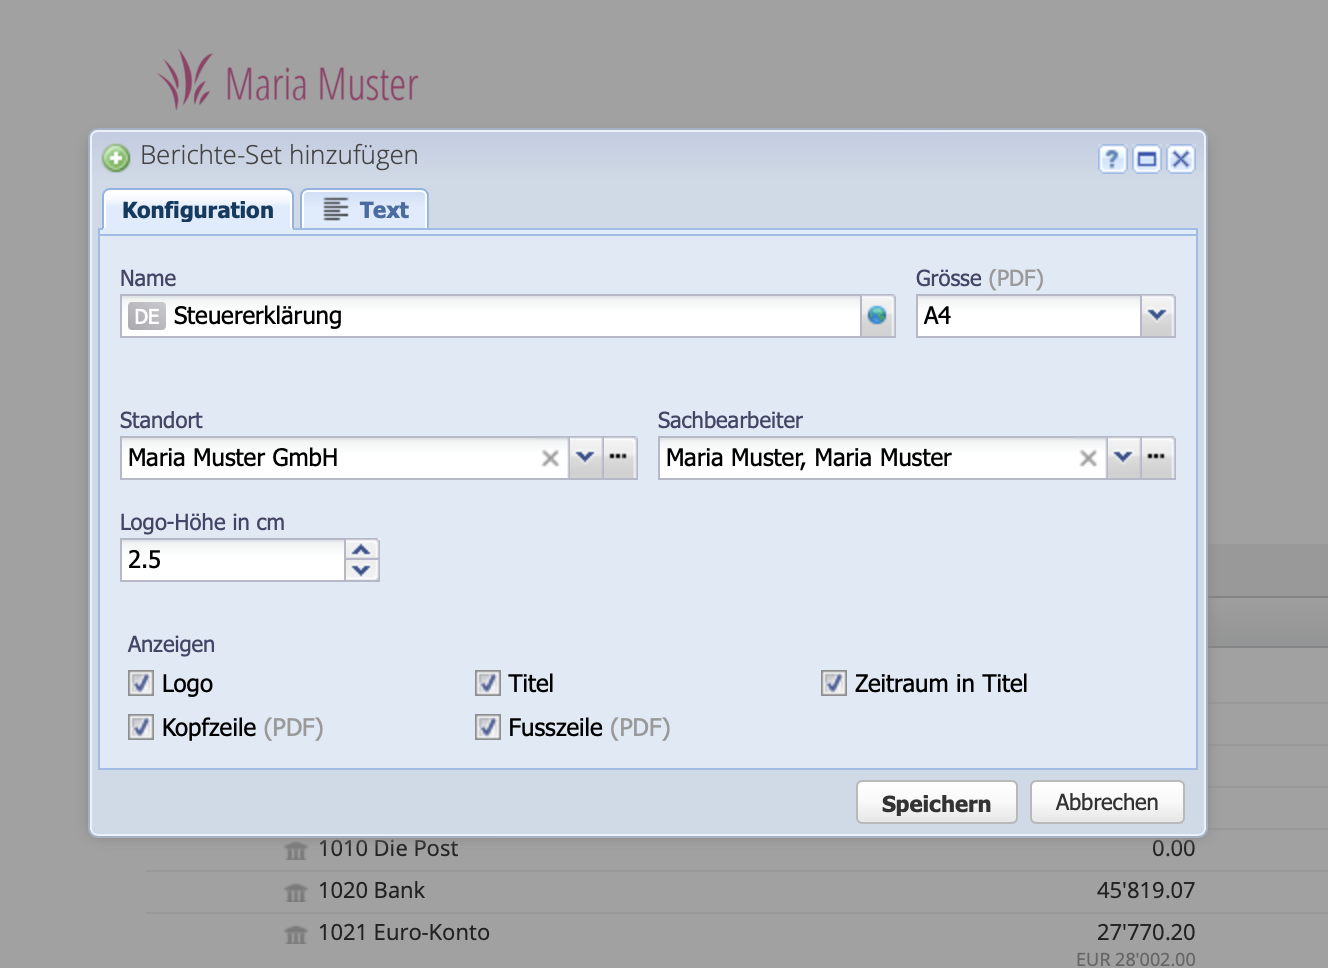
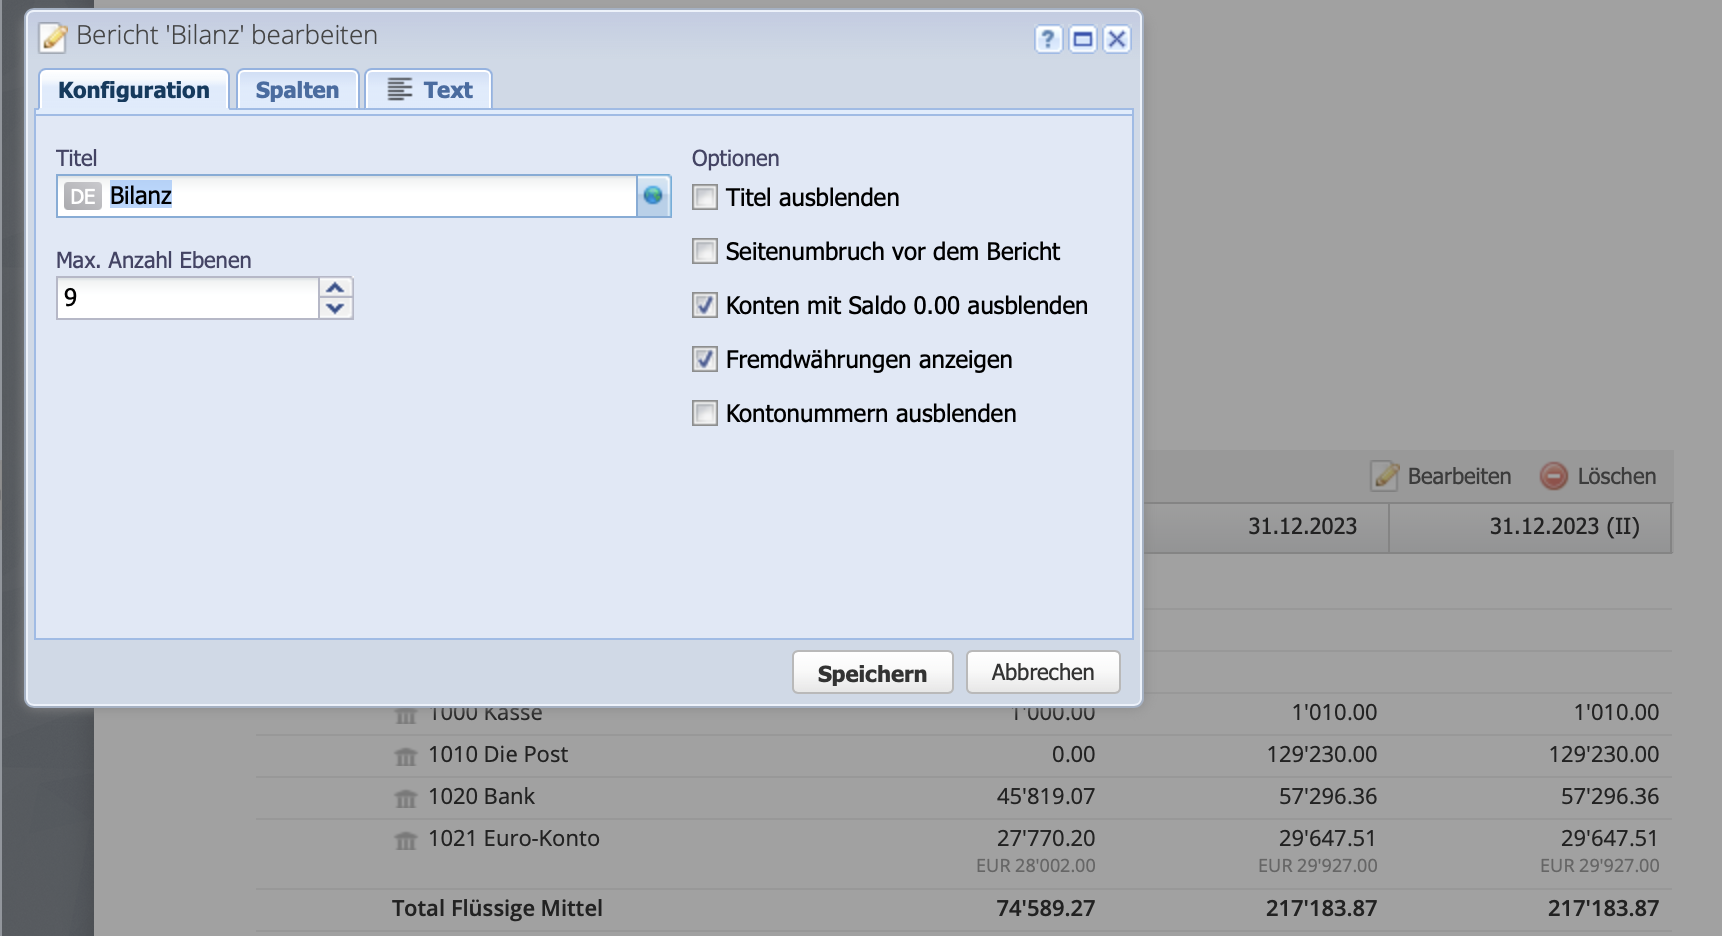
The set must be given a name such as "Sales statistics", a title text, location and responsible person can be defined. There are also display options for logo, header, footer, title and period.

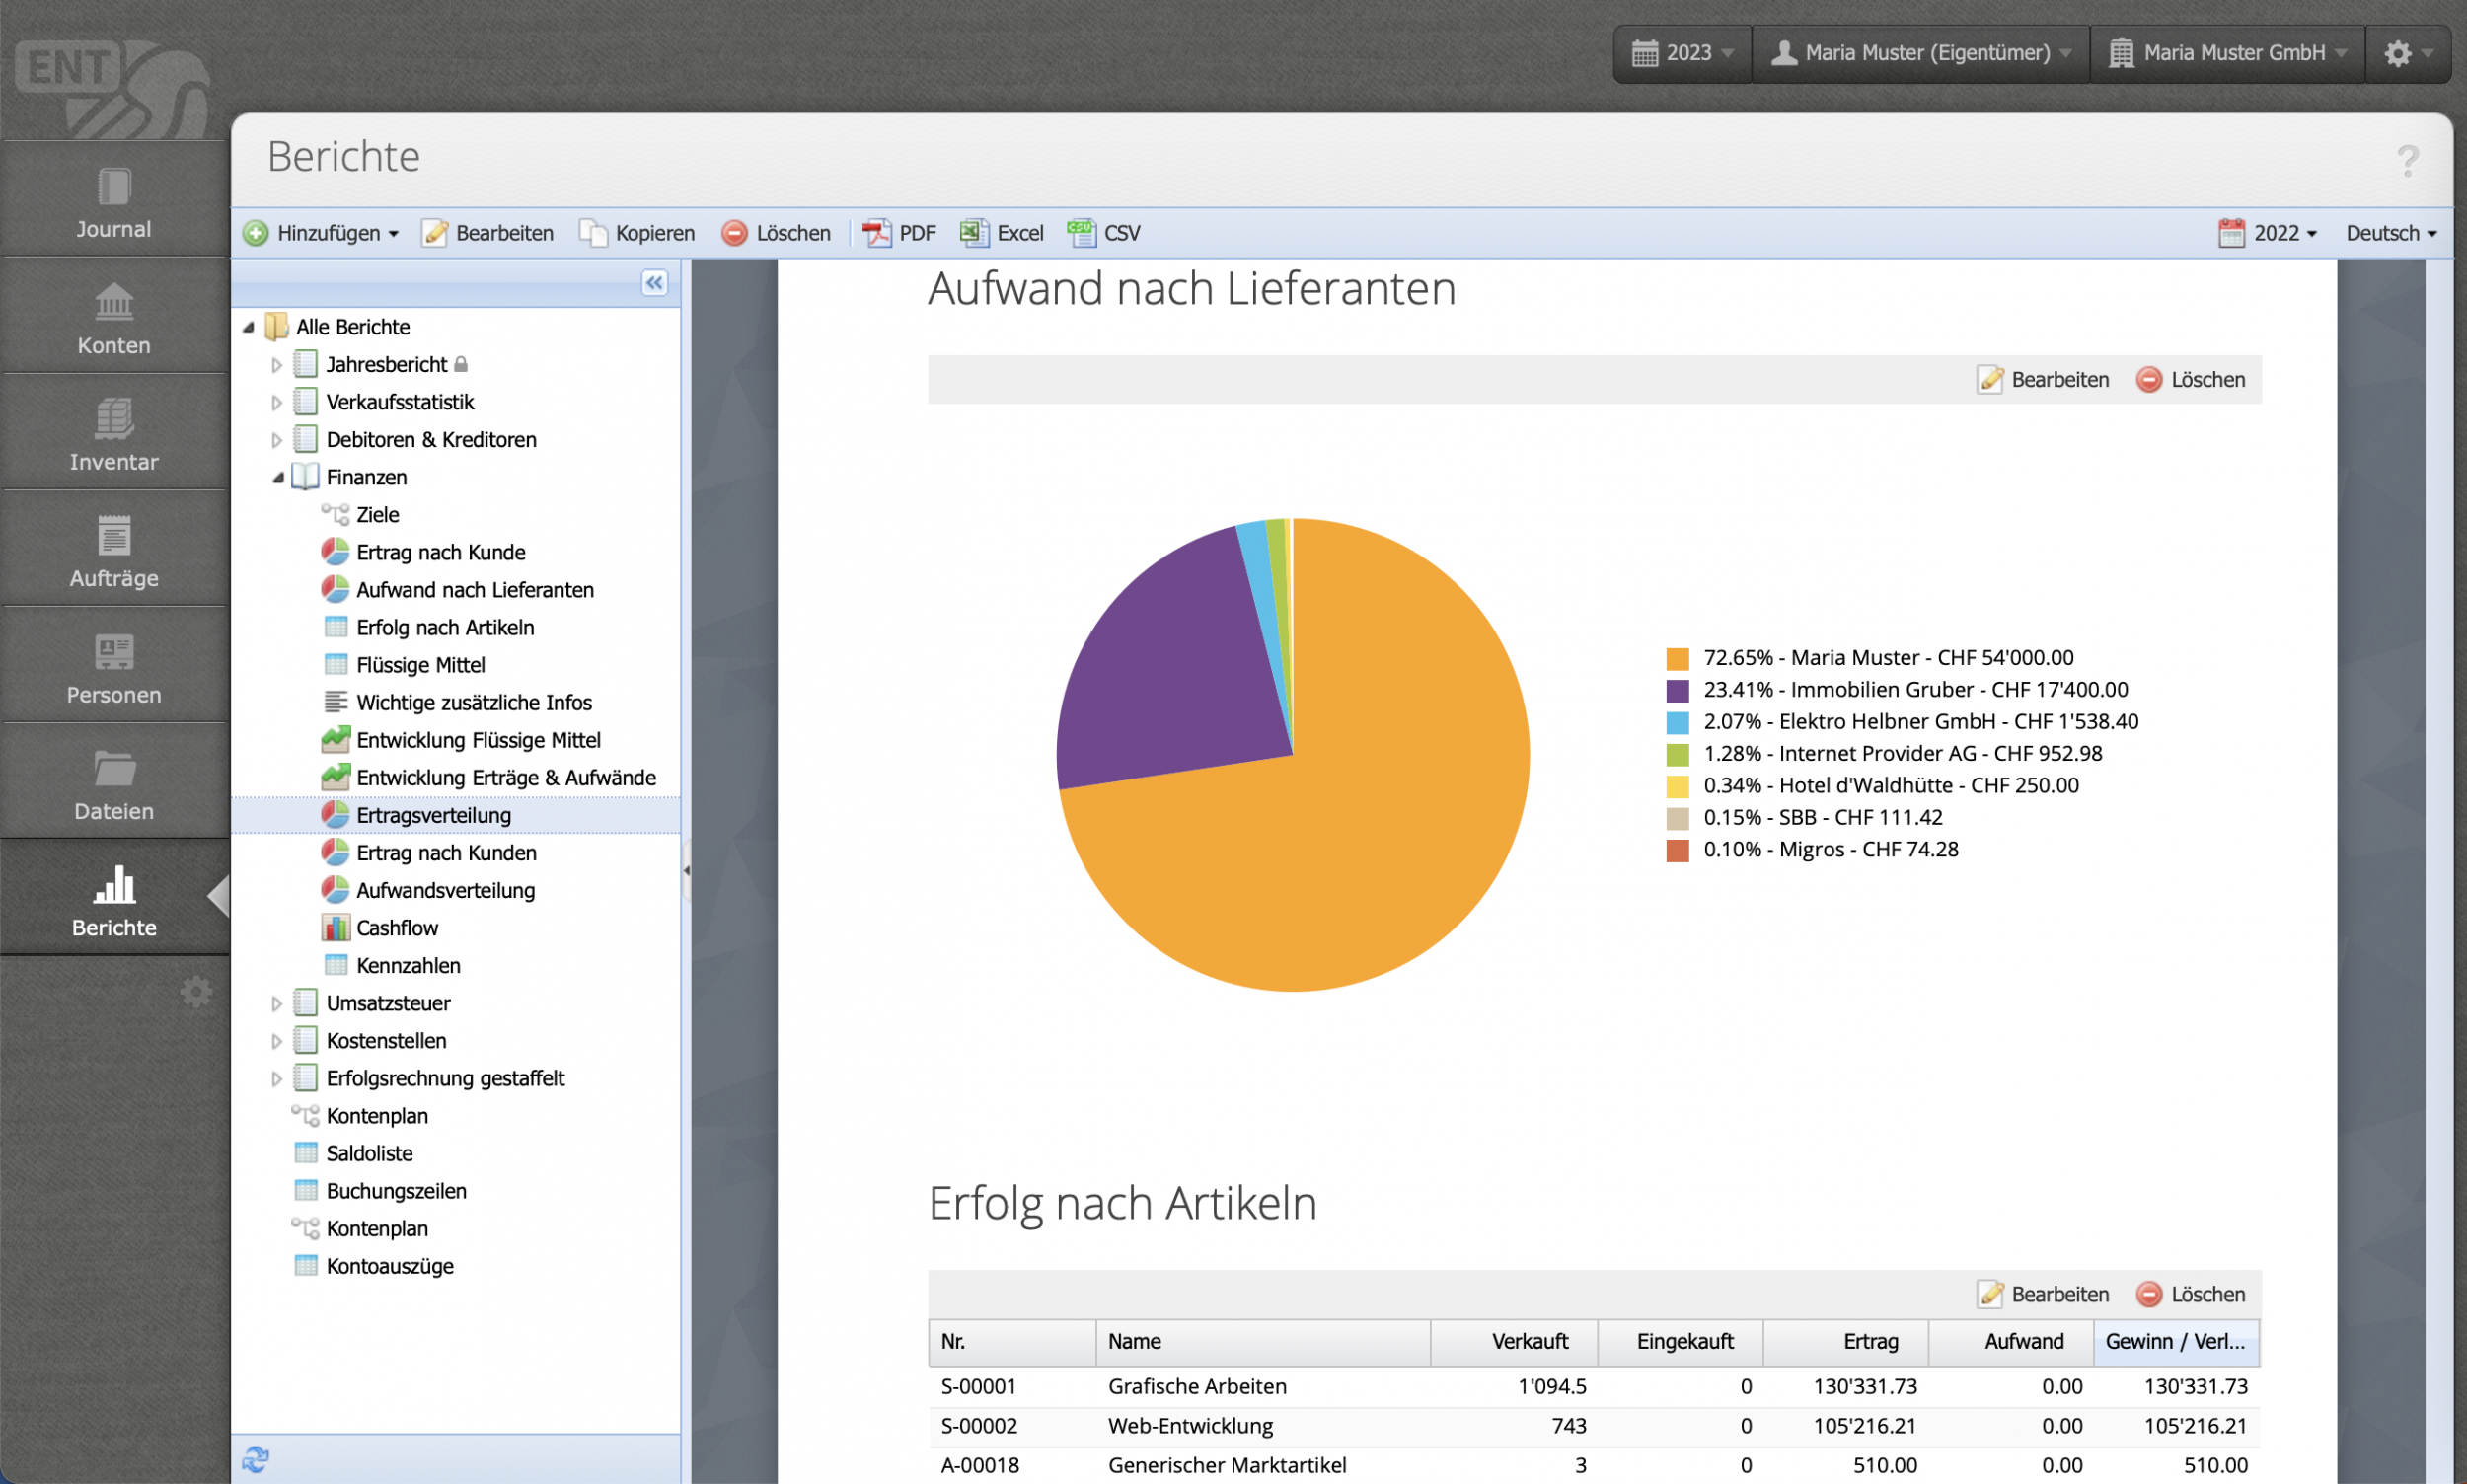
The format can be selected in the dropdown menu at Size, e.g. A4 landscape (A4R) or A3 can be selected.

Screenshot of the configuration of a report set

2. Add report to set

Several reports can be added to the set, e.g. "Revenue by customer", "Expense" by "Suppliers", and so on. To do this, select the set and add the desired report to the set at the top via Add .

Each report has individual options and the possibility to add a title and a description text. Useful if the reports are to be shared.

Screenshot CashCtrl Reports Add Dropdown Menu

3. Arranging / moving reports

Reports and report sets can be arranged as desired. They can be moved using drag & drop, i.e. click on the element, hold the mouse button and release it again at the desired location where the dashed line appears

Reports can be moved within a set or into another set. It is also possible to drag a report out of a set and place it under All reports below the report sets.

The order of the report sets can also be adjusted the same way.

Screenshot of arranging / moving a report within a set

4. Set time period

The evaluated period of the reports can be displayed independently of the fiscal period. On the right side at the top, a period can be selected, e.g. 2023 / Q2, and all reports will use this period. Next to it, the language of the report can be changed.

Screenshot dropdown menu Select period in reports

5. Configure report/ add text

The Edit button at the top or directly at the report opens the dialog. Here, in the Configuration tab, different options can be selected depending on the report, such as displaying the time period in the title, etc.

In the Text tab, an accompanying text can be created for the respective report.

Screenshot of the configuration of a report

6. Customize columns

In the Edit dialog of the report switch to the Columns tab. Here you can add, copy, move or remove columns. The order of the columns can be adjusted via drag&drop.

Via Reset the default columns in the respective report are restored.

Screenshot of the configuration of a report with the columns tab, where columns can be added, deleted and moved.

7. Using formulas with the formula column

The formula column is used to calculate individual key figures. It is available in all tabular reports, but not in graphical reports such as the pie chart.

Via Add Custom a new, custom column is created. Here a title can be defined for it as well as a placeholder to use the value of this column in another formula column as a placeholder.

In the Calculation field, the following operators + - / * can be used to perform the basic arithmetic operations. Use to show the drop-down menu for further calculation operators as well as to choose columns / custom fields.

This column is suitable, for example, to create a column for the margin or other calculations.

Screenshot of the configuration of a report with the addition of a custom column with a custom calculation

8. Export reports

Finally, the compilation can be exported as PDF or exported as Excel / CSV file (CashCtrl PRO). This is easily done using the corresponding buttons above the report (PDF, Excel, CSV).

Screenshot from exporting the reports